Today, colleagues from around the globe and I published a paper in Nature Communications titled “Biodiversity enhances ecosystem multifunctionality across trophic levels and habitats.” The paper is an important step forward in connecting biological diversity — the variety of organisms living in an ecosystem — to the myriad processes operating in natural, functioning ecosystems. Its worth digging a bit into this analysis, and explaining a little bit about why its important.
Our report synthesizes across nearly 100 experiments that manipulated biological diversity (the number of species) and measured the consequences for ecosystem functioning — properties and processes that support an ecosystem. Functions include things like growth (biomass production), resource use (consumption), nutrient cycling, and decomposition. Functions often underpin services, or ecosystem properties that benefit humanity. Examples of ecosystem services are fisheries (supported by biomass production), and clean water (supported by nutrient cycling and decomposition). Hence why biodiversity is often implicated in human well-being.
On top of that, we are losing species. As we continue to exert a dominant influence over the natural world, we destroy and fragment habitats (thinking cutting down the rainforest) and exploit populations (thinking overfishing). The consequence is, unsurprisingly, extinctions, and lots of them. Some estimates suggest that the number of extinctions in the recent past is one thousand times greater than at any point in the history of the planet (aka, the fossil record). So the pressing question is: what are the consequences of losing all these species for ecosystems, and ultimately for us?
What is ‘ecosystem multifunctionality’?
The experiments in our analysis answered this question by directly manipulating diversity and measuring the ecosystem consequences in the form of functions. Controlled experiments such as those included in our analysis are ideal for exploring the effects of diversity loss, because the ecosystem consequences can be directly attributed to changing the number of species.
There have been hundreds, if not thousands, of experiments to date that have conducted these kinds of manipulations, with more being published every day. However, the vast majority of these have measured only a single ecosystem function (usually standing stock biomass). This is a somewhat simplified view of an ‘ecosystem.’
If you Google “define: ecosystem” the first definition that pops up is:
a biological community of interacting organisms and their physical environment.(in general use) a complex network or interconnected system.
The keywords being “complex” and “interconnected.” Ecosystems are comprised of many more functions than biomass, and to truly get at the consequences of diversity loss, we must consider the entirety of this “complex network.”
Which brings me (finally) to a definition of ecosystem multifunctionality:
The simultaneous provision of multiple functions in nature.
Thus, we combed through the hundreds of experiments and chose only those that measured two or more functions, and combined information from those to derive an index of multifunctionality.
Crossing the threshold of multifunctionality
So what is this index? There have been a number proposed over the years, summarized nicely in this table from a recent publication in Methods in Ecology and Evolution.

I won’t go into the history in detail (check out the paper for that), but suffice it to say the approach we settled on is dubbed the ‘multiple threshold approach.’ To understand what this is, let’s first consider a hypothetical biodiversity manipulation, summarized in Figure 1a from our paper:

Here, we have three species by themselves (1, 2, and 3), and then all three in mixture, and we have measured the mean of 2 hypothetical ecosystem responses (white and light grey bars — ignore the dark grey bars for now).
For these functions, we can set a threshold based on the maximum mean level of functioning across all treatments. That’s a bit confusing, so consider we have a set of means: 0.3, 0.2, 0.3, 0.9, and 0.5. We can choose the maximum mean value — 0.9 — and use that to set the target value for the system: a maximum that we know can be obtained.
Next, we can ask: how many functions reach some percentage — some threshold — of that target? This threshold can be set arbitrarily, or might be set by a management goal. So, in the figure above, we could ask how many functions achieve, say, 50% of the maximum (0.5).
For species 1, that’s only 1 function (light grey bar). For species 2 its neither function, and for species 3 its both functions. The mixture also achieves both functions. The number of functions greater than the threshold — 1 for species 1, 0 for species 2, and so on — is our index of multifunctionality. We can regress this against diversity to see how multifunctionality changes (green dashed line for our 50% threshold):

A positive slope means diversity has a positive effect of multifunctionality.
If this seems a bit convoluted, there is a method to the madness. By expressing multifunctionality as the number of functions greater than a threshold, we can explicitly address the issue of trade-offs among functions. By trade-offs, I mean scenarios where one function is low when another is high. For instance, in Swedish forests, berry biomass must be low when tree biomass is high, because high tree biomass indicates lots of shading and no light for berry bushes. Trade-offs are important and widespread in the natural world and we need to understand when (if ever) we can expect biodiversity to maximize all functions.
The issue of trade-offs is why we don’t take a simple average (dark grey bar in the figure above). If the average multifunctionality is 0.5, does this indicate that all functions are performing around the same, intermediate level, or does it mean that some are high (near 1) and others are low (near 0)?
The threshold approach rectifies this because when trade-offs are present, the number of functions greater than the threshold can never equal the total number of functions measured.
But then the questions arises: how do you choose a threshold?
The answer is, you don’t have to if you don’t want to (for instance, if there is no target level of functioning). You can simply calculate the number of functions greater than the threshold for ALL thresholds, from 1% to 99% of the maximum.
We can see a few thresholds along this continuum: 30, 50, and 90% corresponding to the dotted blue, dashed green, and solid red lines in the figure above. We can get a slope from each of the regressions: 99 in total.
By plotting the 99 slopes against threshold, we gain further insight, specifically, whether the diversity effect changes against threshold

If, for instance, the effect was still positive at increasing thresholds, then it would suggest that diversity is key to bringing multiple functions close their maximum.
Around the world in 94 studies
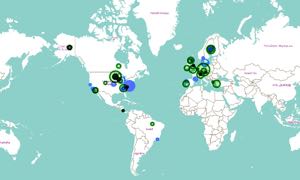
Now that we’ve settled on the framework, its down to the arduous task of assembling the raw data from all the publications that manipulated species diversity and measured two or more functions. In total, we managed to extract data from 94 studies that ran the gamut from terrestrial to aquatic and spanned multiple trophic levels, from plants and detritivores to herbivores and carnivores.
We’ve generated an interactive map plotting the extent of all of these studies: click below to play around!
What did we find?
In sum: biodiversity promotes ecosystem multifunctionality.
Regardless of how we sliced it, biodiversity almost always enhanced levels of multiple ecosystem functions, regardless of number of functions, habitat, trophic level, and study.
For instance, remember the plot of diversity against number of functions greater than a threshold? Let’s see what it looks like for studies that measured 12 functions:
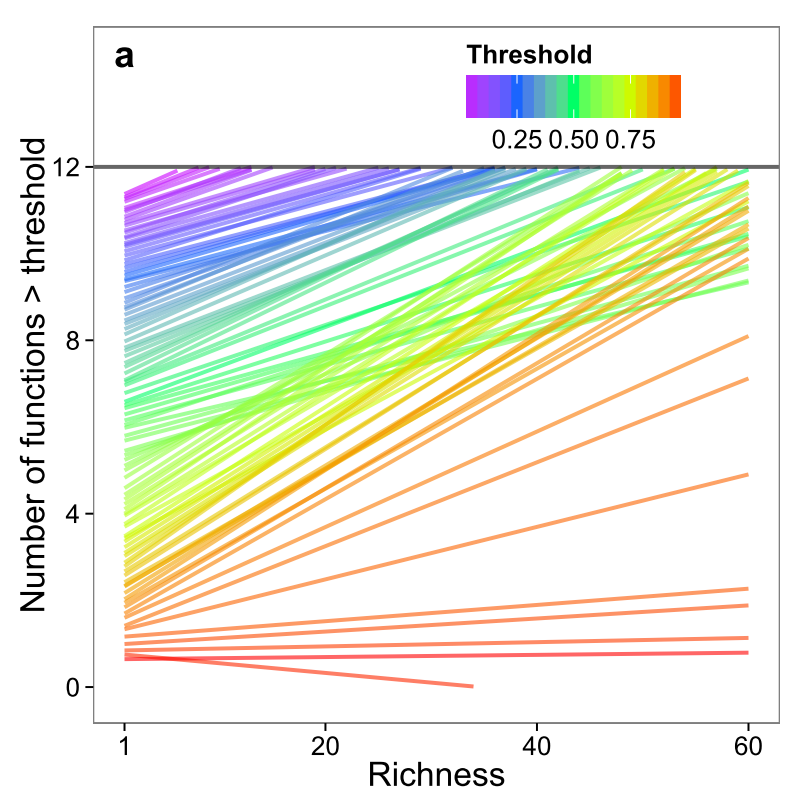
See those slopes? Almost always positive until the very highest thresholds — in other words, diversity matters!
Let’s take the slopes of those regressions and plot them against threshold, and break it up for different numbers of functions:

This looks a bit more complicated but each curve represents a different number of functions, from 2-12. You can see that the effect (y-axis) is almost always positive (the shaded 95% confidence intervals do not overlap zero). And, for the most part, the curves track one another (except for an odd blip around 50% thresholds — see the paper for more discussion on that!), and up until the very end.
At high thresholds, the red curves representing many functions stay pretty high up until about the 90% threshold, then follow the blue curves towards zero. What does this mean? Simply put, that the effect of biodiversity — the slopes from those regressions — are higher with an increasing number of functions. In other words, biodiversity becomes more important as more functions are considered.
As we consider more and more realistic ecosystems comprised of many, many interconnected processes, diversity has more potential to boost those processes to high levels.
Interestingly, our results also confirmed a long-standing suspicion that animal diversity may be more important than plant diversity, for a number of reasons: animals are more physiogically, biologically, and behaviorally complex, and have a more diverse and varied resource pool.

Here, the patterns are fairly uninteresting for manipulations of dead organic matter and detritivores. There is a slight bump for plants, and a massive bump for herbivores.
On a final note, we did a rudimentary exercise exploring whether the same species or different species drove multiple functions in monoculture (by themselves). We found that, on average, around 70% of functions were maximized by different species, underscoring the notion that one species cannot do it all.
Tying it all together
The implications of the analysis are clear: want to maximize ecosystem functioning? Maximize biodiversity.
That’s been a bit hyperbolic, but I do think that managers and policymakers who are looking to maximize the functions and services from natural ecosystems should strongly consider conservation of biodiversity as a ‘blanket’ solution, in addition to more targeted activities. This, of course, is hardly a new idea, but our paper represents systematic empirical evidence for such a claim.
As with any meta-analysis, the results are only as robust as the studies that have already been conducted. The number of studies that measured a large number of functions dropped off precipitously. Even then, the study that measured the most functions (from the Jena manipulations in Germany) reported only 12. To truly validate these results, we must expand the breadth of ecosystem responses measured in future studies.
In the interim, however, our analysis is the best representation of the effects of biodiversity on multiple ecosystem functions, and illustrates the general application of an exciting framework for quantifying ecosystem multifunctionality.
Further Reading
J.S. Lefcheck, J.E.K. Byrnes, F. Isbell, L. Gamfeldt, J.H. Griffin, N. Eisenhauer, M.J.H. Hensel, A. Hector, B.J. Cardinale, J.E. Duffy. “Biodiversity enhances ecosystem multifunctionality across trophic levels and habitats.” Nature Communications 6: 6936. DOI: 10.1038/ncomms7936.
J.E.K. Byrnes, L. Gamfeldt, F. Isbell, J.E. Duffy, J.S. Lefcheck, J.N. Griffin, A. Hector, B.J. Cardinale, D.U. Hooper, L.E. Dee. 2014. “Investigating the relationship between biodiversity and ecosystem multifunctionality: Challenges and solutions.” Methods in Ecology and Evolution 5(2): 111-124.
Biodiversity promotes ecosystem multitasking. Virginia Institute of Marine Science.
